Setting up the Arduino Zero Built-in Debugger Interface
Learn how to set up the Arduino Zero built-in debugger interface, which can be used directly with the IDE 2, without any extra hardware.
For this this tutorial we will be using the Arduino Zero's built-in debugger interface: no extra hardware needed.
Requirements
- Arduino IDE 2 installed.
- Arduino Zero
- Micro USB cable.
Configuration
1. Connect the Arduino Zero board to our computer. We also need to make sure we have the right platform installed (SAMD).
Important: You should connect the Arduino Zero through its programming USB port.
2. Select the board from the board/port list.
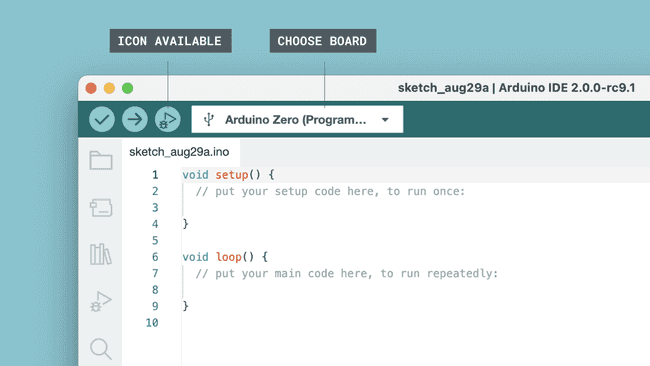
3. Select Tools > Programmer > Atmel EDBG. The debugger icon close to the upload button will now become more visible.

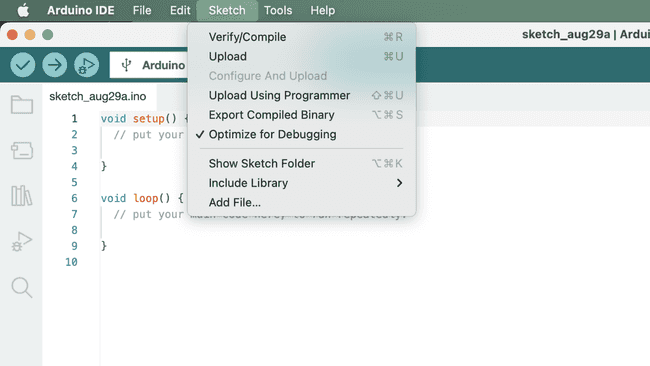
3. To use the debugger, we first need to make sure the built program will be optimized for debugging, so let's enable that option by navigating to Sketch > Optimize for Debugging and checking it.

4. Your Arduino Zero is now ready to be debugged using the Arduino IDE 2.
To learn more about using the Debugger, you can continue on to the main article on Debugging with IDE 2. This article goes more in-depth on how to use the different Debugger features, and provides a good overview of the tool.
Conclusion
In this short tutorial, we set up the Arduino Zero for Debugging. Since the board already has a built-in debugger, we do not need to do any hardware configuration at all, which is one the greatest features of the Arduino Zero board.
Suggest changes
The content on docs.arduino.cc is facilitated through a public GitHub repository. If you see anything wrong, you can edit this page here.
License
The Arduino documentation is licensed under the Creative Commons Attribution-Share Alike 4.0 license.