Debugging the Arduino UNO R4 Minima
Learn how to debug the UNO R4 Minima.
Debugging is the process of identifying and fixing errors in your code. It’s a vital skill for anyone writing code especially when dealing with microcontrollers like those on your Arduino. As with everything, debugging can be done at different levels, you can read up on the topic here.
In this context, debugging is a term used to describe the process of inspecting the code at different points in time.
An analogy that is often used is to think of it as "stepping into" the code, grabbing full control of the clock and walking through it line by line, checking the value of variables as you go, and reading specific memory addresses to make sure information is being passed on as intended.
This is especially helpful when creating complex projects, but even as a beginner, it can be helpful to know the basics of debugging, consequently saving you time and energy when trying to find the little annoying error causing your program to break down.
This article covers the basic steps for debugging the UNO R4 Minima using the SWD pins and a J-Link® debugger.
In addition to the necessary hardware we also need some software allowing us to set breakpoints in our code. A breakpoint is an intentional stopping or pausing place at a specific point in the code, allowing you to read values at that exact point. In this case, we will be using Ozone which is a software developed by Segger®. It’s a graphical debugger for embedded applications and we can use it to set breakpoints, read out memory addresses, and read the value of any variable at a specific point in time.
Goals
The goals of this tutorial are:
- learn about the basics of debugging.
- learn how to connect the UNO R4 Minima to the Segger J-Link debugger.
- learn how to use the Ozone debugger software to debug an Arduino sketch.
Hardware & Software Needed
Debugging
Debugging your Arduino project allows you to dive deep into your code and troubleshoot as well as analyze the code execution. J-Link is a popular debugging tool that provides a direct connection between your computer and the Arduino board. By connecting it you can gain full access to the microcontroller's internal registers, memory, and variables. This is especially helpful when working on more complex projects where understanding the code execution flow is crucial. With J-Link and Ozone, you can step through the code line by line, allowing you to analyze why your code might break at a specific point.
Connection
Connecting the J-link to your UNO R4 Minima is super easy because there are special pins for debugging labeled as SWD pins.
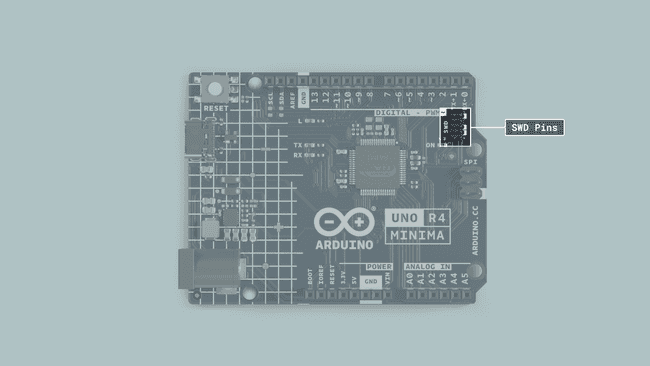
Your J-link should come with a cable included and if you look closer you will see that one side is marked with red, indicating the orientation of the cable. The red side of the cable should be on the same side as the VCC pin on the SWD pad. To know the exact orientation of your cable be sure to check the respective documentation or datasheet of your debugger but you can start with the orientation as shown below and if it doesn't work you can try placing it differently until you get a working connection. Once we start using the debugger software in the following steps you will know if the cable is placed correctly.
Software
Setting up with the Arduino IDE
First, if you haven't done it yet, install the Arduino IDE and connect your UNO R4 Minima. When uploading a sketch to your Arduino board with the Arduino IDE, it will build an
.ELF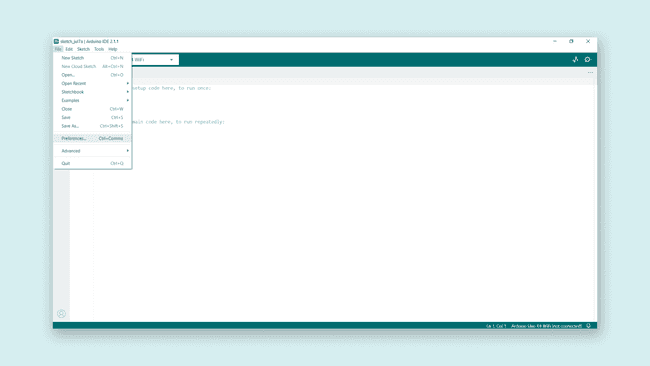
When you have the preferences window open, look for the Show verbose output during: compilation option and make sure that the checkbox is ticked.
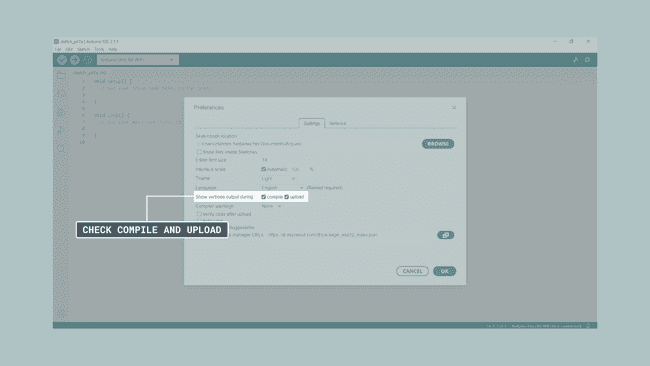
Now we are ready to upload the script that we want to debug. If you don't have a sketch to test, you can use any example sketch found in the IDE.
When we upload the sketch with the Arduino IDE, we need to know where the
.ELFC:\Users\profile\AppData\Local\Temp\arduino_build_815037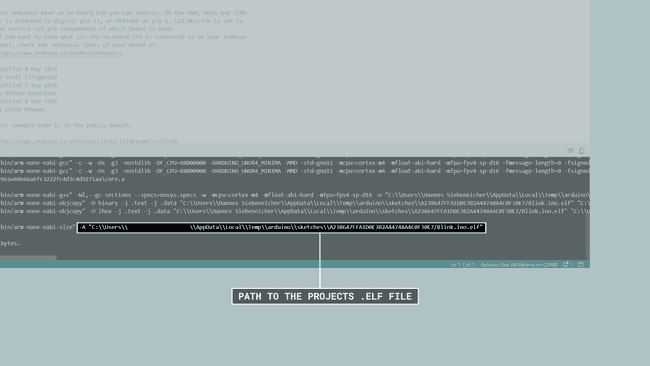
Using the Setup with Segger® Ozone
Download and install Ozone debugger. If you are on Windows, make sure to also download the J-Link Software and Documentation Pack for Windows.
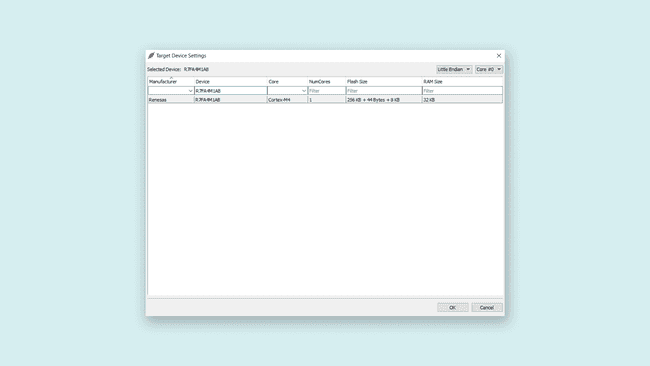
When starting Ozone, make sure to enter the correct CPU into the settings box. The UNO R4 Minima uses the R7FA4M1AB.
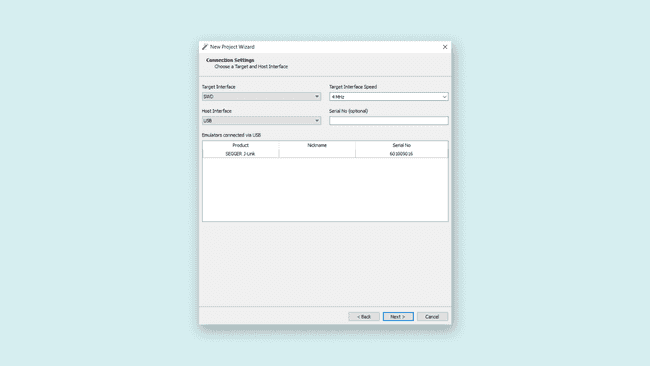
Continue to the next step. Here you need to change the Target Interface to SWD. Then select your J-Link device in the list of emulators and head to the next page.
Now you get to the window that asks you to select the program to be debugged, this is where you load the project's
.ELF.ELF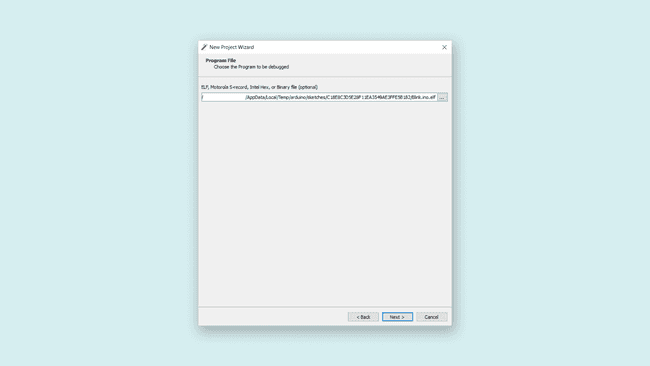
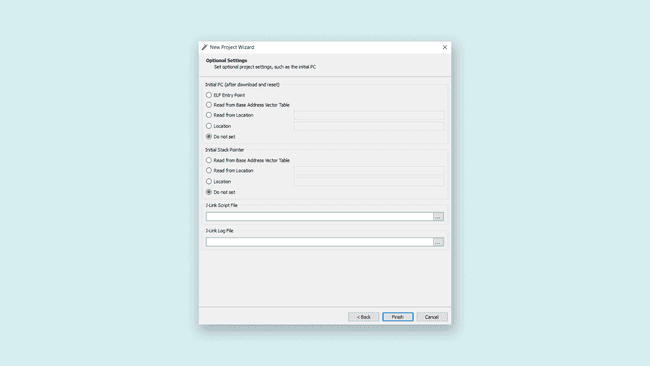
In the 'optional settings' dialog, set both options 'Initial PC' and 'Initial Stack Pointer' to 'Do not set' as it would skip the Arduino bootloader, otherwise this may prevent the sketch from running correctly.
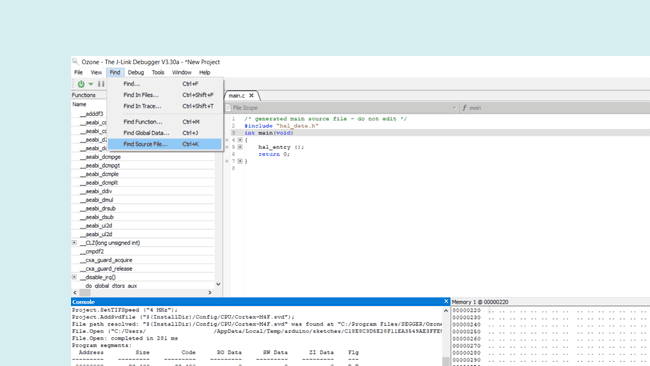
When the setup is finished, Ozone will open the file containing the main function. You will note that this is not the .ino sketch you wrote since this is an abstraction layer generated by the IDE. To open our .ino sketch we need to go to Find > Find source file in the top toolbar.
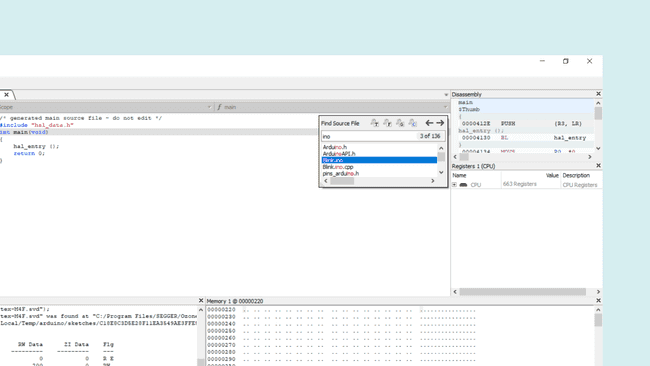
In the little window that appears, type ".ino". You should now be able to see the file, select the file and open it in Ozone.
Setting Breakpoints
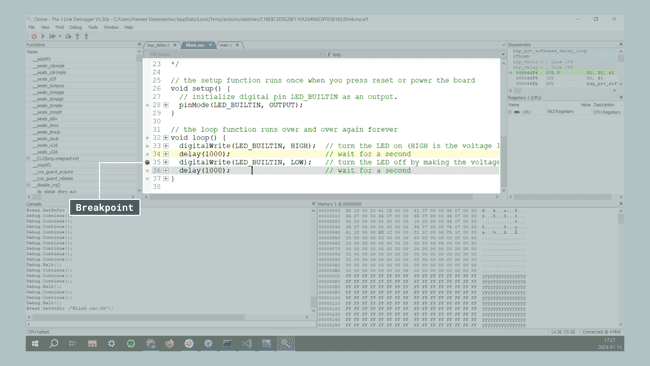
As mentioned above a breakpoint is an intentional stopping or pausing place at a specific point in the code. You can add them by clicking the sidebar next to your sketch, and you should see a red dot appear. You have now set a breakpoint.
Now you are ready to start debugging. Simply go to Debug > Download & Reset Program to start debugging your sketch.
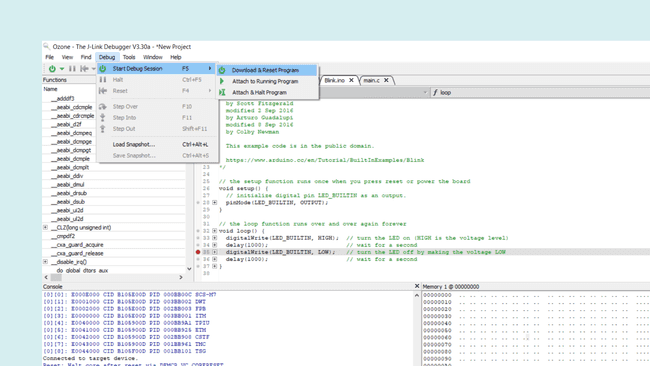
You will see how your code is executed and stopped at the line you set the breakpoint. You can set as many breakpoints as you want, depending on where you want to stop your code. For more information about the features present in the Ozone debugger, please go here.
Conclusion
In this tutorial, you learned how to connect your UNO R4 Minima board to a J-Link device using the SWD pins and use it with the Ozone debugger. We also went through how to create a file with Arduino IDE that can be debugged in Ozone. And eventually how to use the Ozone debugger to debug an Arduino sketch.
Suggest changes
The content on docs.arduino.cc is facilitated through a public GitHub repository. If you see anything wrong, you can edit this page here.
License
The Arduino documentation is licensed under the Creative Commons Attribution-Share Alike 4.0 license.